Welcome to Hexo! This is your very first post. Check documentation for more info. If you get any problems when using Hexo, you can find the answer in troubleshooting or you can ask me on GitHub.
This is an R Markdown document. Markdown is a simple formatting syntax for authoring HTML, PDF, and MS Word documents. For more details on using R Markdown see http://rmarkdown.rstudio.com.
When you click the Knit button a document will be generated that includes both content as well as the output of any embedded R code chunks within the document. You can embed an R code chunk like this:
1
summary(cars)
1
2
3
4
5
6
7
##      speed           dist
##  Min.   : 4.0   Min.   :  2.00
##  1st Qu.:12.0   1st Qu.: 26.00
##  Median :15.0   Median : 36.00
##  Mean   :15.4   Mean   : 42.98
##  3rd Qu.:19.0   3rd Qu.: 56.00
##  Max.   :25.0   Max.   :120.00
Including Plots
You can also embed plots, for example:
Note that the echo = FALSE parameter was added to the code chunk to prevent printing of the R code that generated the plot.
그림 1
그림 2
Posted Updated jihoon a minute read (About 214 words)
This is an R Markdown document. Markdown is a simple formatting syntax for authoring HTML, PDF, and MS Word documents. For more details on using R Markdown see http://rmarkdown.rstudio.com.
When you click the Knit button a document will be generated that includes both content as well as the output of any embedded R code chunks within the document. You can embed an R code chunk like this:
1
summary(cars)
1
2
3
4
5
6
7
##      speed           dist
##  Min.   : 4.0   Min.   :  2.00
##  1st Qu.:12.0   1st Qu.: 26.00
##  Median :15.0   Median : 36.00
##  Mean   :15.4   Mean   : 42.98
##  3rd Qu.:19.0   3rd Qu.: 56.00
##  Max.   :25.0   Max.   :120.00
Including Plots
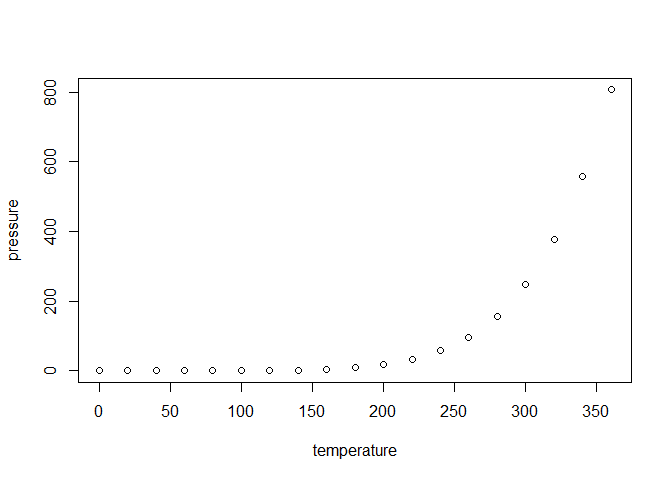
You can also embed plots, for example:
1
plot(pressure)
Note that the echo = FALSE parameter was added to the code chunk to prevent printing of the R code that generated the plot.
# welchTwoSample t-test # data: ctybytrans # t = -4.5375, df=132.32, p-value = 1.263e-05 # 1.263/100000 # alternativehypothesis: true difference in means is not equal to 0 # 95 percent confidenceinterval: # -3.887311 -1.527033 # sample estimates: # mean in group auto mean in group manual # 15.96815 18.67532
결론: cty 평균거리는 auto가 15.79마일, manual이 18.68마일이다. 유의수준(p)이 0.05보다 작아서 통계적으로 유의미한 차이가 있기 때문에 수동식의 평균이 자동식의 평균보다 2.7 마일 길다고 할 수 있다.
# 방법3 #summary(table(mpg1$trans, mpg1$drv)) #Number of cases in table: 234 # 행의수 #Number of factors: 2 #비교 범주의 수 #Test for independence of all factors: # chiq = 3.1368, df = 2, p-value = 0.2084
유의수준(P-value)이 0.2084로 p>0.05이다. 귀무가설 영역이므로 trans에 따라 drv에 차이가 있다고 할 수 없다.
3) 상관관계분석
상관관계분석은 R에 내장되어 있는 cor.test() 함수로 한다.
귀무가설 : cty와 hwy는 상관관계가 없다.
대립가설 : cty와 hwy는 상관관계가 있다.
1
2
3
mpg1 <- read.csv("mpg1.csv", stringsAsFactors =F)
cor.test(mpg1$cty, mpg1$hwy)#상관관계분석
1 2 3 4 5 6 7 8 9 10 11
## ## Pearson's product-moment correlation ## ## data: mpg1$cty and mpg1$hwy ## t = 49.585, df = 232, p-value < 2.2e-16 ## alternative hypothesis: true correlation is not equal to 0 ## 95 percent confidence interval: ## 0.9433129 0.9657663 ## sample estimates: ## cor ## 0.9559159
p-value <2.2e-16. 즉, 유의수준이 2.2/1016보다 작다. 따라서, 대립가설을 채택할 수 있다.
상관관계는 0.9559159이다. 매우 높은 수준이다.
결론 : cty와 hwy는 유의미하게 매우 높은 상관관계(r=0.96)에 있다.(p<0.05)
Colab 메모장을 사용하면 실행 코드와 서식 있는 텍스트를 이미지, HTML, LaTeX 등과 함께 하나의 문서로 통합할 수 있습니다. Colab 메모장을 만들면 Google Drive 계정에 저장됩니다. Colab 메모장을 간편하게 공유하여 동료나 친구들이 댓글을 달거나 수정하도록 할 수 있습니다. 자세히 알아보려면 Colab 개요를 참조하세요. 새 Colab 메모장을 만들려면 위의 파일 메뉴를 사용하거나 다음 링크로 이동하세요. 새 Colab 메모장 만들기
Colab 메모장은 Colab에서 호스팅하는 Jupyter 메모장입니다. Jupyter 프로젝트에 관해 자세히 알아보려면 jupyter.org를 참조하세요.
데이터 과학
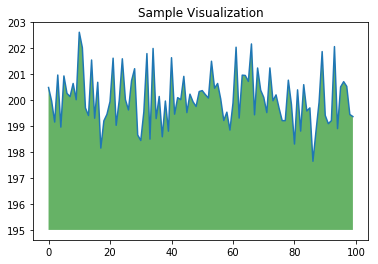
Colab을 통해 인기 있는 Python 라이브러리를 최대한 활용하여 데이터를 분석하고 시각화할 수 있습니다. 아래 코드 셀에서는 Numpy를 사용하여 임의의 데이터를 생성하고 매트플롯립으로 이를 시각화합니다. 셀을 클릭하면 코드 수정을 바로 시작할 수 있습니다.
1
2
3
4
5
6
7
8
9
10
11
import numpy as np from matplotlib import pyplot as plt
ys = 200 + np.random.randn(100) x = [x for x inrange(len(ys))]
Google Drive 계정에서 스프레드시트를 비롯한 데이터를 Colab 메모장으로 가져오거나 GitHub 등의 여러 다른 소스에서 데이터를 가져올 수 있습니다. Colab을 데이터 과학에 활용하는 방법과 데이터 가져오기에 관해 자세히 알아보려면 데이터 사용하기 아래 링크를 참조하세요.
머신러닝
Colab을 사용하면 코드 몇 줄만으로 이미지 데이터세트를 가져오고, 이 데이터세트로 이미지 분류기를 학습시키며, 모델을 평가할 수 있습니다. Colab 메모장은 Google 클라우드 서버에서 코드를 실행하므로 사용 중인 컴퓨터의 성능과 관계없이 GPU 및 TPU를 포함한 Google 하드웨어의 성능을 활용할 수 있습니다. 브라우저만 있으면 사용 가능합니다.
Colab은 다음과 같은 분야의 머신러닝 커뮤니티에서 널리 쓰이고 있습니다.
TensorFlow 시작하기
신경망 개발 및 학습시키기
TPU로 실험하기
AI 연구 보급하기
튜토리얼 만들기
머신러닝 적용 사례를 보여 주는 Colab 메모장 샘플을 확인하려면 아래 머신러닝 예시를 참조하세요.